The Legs Table displays a summary of each leg in the race for each track. This is the first place to look to find out which parts of the race were most competitive and which were least.
For example, the time column quickly indicates who sailed the leg fastest and who slowest. The Distance column indicates who sailed the shortest distance - especially important for upwind legs.
Note: You must first define the event to see the legs.
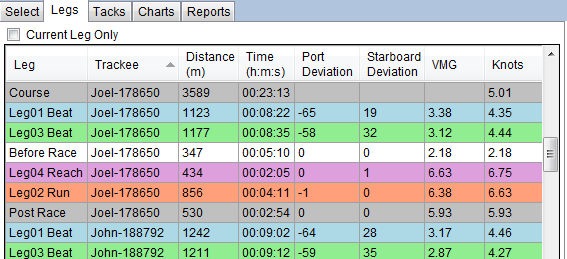
The highlighted row indicates the current leg, for the current track. If you run the race player, you will see the highlight move each time the current track starts a new leg.
You can also select a leg by clicking with the mouse, or using the up and down arrow keys. Each time you select a leg, the player moves to the end of the selected leg.
You can select a column header to sort the table by that column. For example, select the Time column to sort the legs by order of time sailed. Or select the Leg column to sort by Leg name to compare different tracks sailing the same leg.
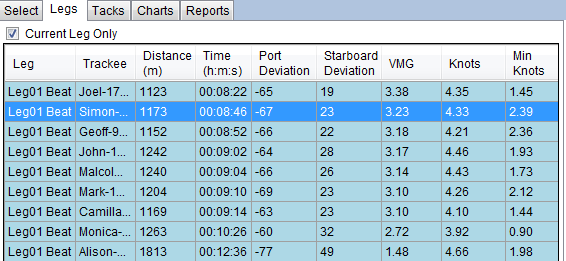
If you have many tracks, you should check the "Current Leg Only" checkbox (now the default).This cuts down the size of the table just to the current leg, and makes it easier to sort competitors within that leg by speed, distance and time.
Notice that the Legs table indicates the point of sailing for the leg (Beat, Reach or Run). As TackTracker analyses each track, it estimates the wind direction, using the assumptions that you can't sail directly upwind, and that you normally tack through a similar angle when sailing upwind. Unless the wind on the day was especially fluky, TackTracker will get it right.
You can override TackTracker's wind estimate by clicking on the Wind icon at the top right of the plot window. See the section titled "Adjusting the Wind Direction" in Using the Track Player.
Legs Table Columns:
Column |
Description |
Leg |
The name of the leg. Each leg is listed sequentially as Leg01, Leg02, etc. A "Course" row is also provided, which gives a summary for the entire race. For example, you can use the Course Row Time to compare total race times for each participant. |
Trackee |
The track identification. (This is most useful when displaying multiple tracks simultaneously.) |
Distance (m) |
The total distance traveled on this leg (in meters) |
Time (h:m:s) |
The time spent on the leg |
Port Deviation (deg) |
The average angle from the direct line from the previous mark to the next mark when sailing on Port Tack |
Stbd Deviation (deg) |
The average angle from the direct line from the previous mark to the next mark when sailing on Starboard Tack |
VMG |
The average speed relative to the rhumb line between the mark at the start of the leg to the mark at the end of the leg. The boat with the highest VMG wins the leg. Units are Km/h or knots depending on the default speed units specified in the Settings dialog. |
Time (h:m:s) |
The time spent on the leg |
Knots / Km/h |
The average speed over the leg. Units are Km/h or knots depending on the default speed units specified in the Settings dialog. |
Min Knots, Max Knots |
The minimum and maximum speeds recorded over the duration of the leg. |
Go to Task Selection