TackTracker can display interactive charts for a variety of different statistics, including your own custom statistics.
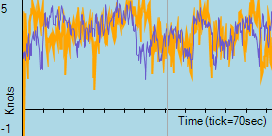
In the chart above, the dips in speed coincide with boats tacking. The vertical line indicates the current position, and moves as the boats move around the course. You can also drag the line with the mouse and move the boats to a point of interest.
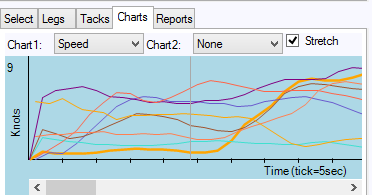
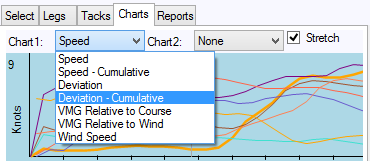
One or two charts may be displayed at one time. The content of the charts may be selected from the drop down boxes at the top:
The table below describes each chart in more detail. Please let us at TackTracker know if you have ideas for any additional charts that may be useful.
For all charts, the horizontal axis represents the time span of the current leg. Note that only the current track will start the leg at the left edge of the chart and finish the leg at the right edge. Other tracks will complete the leg at different times, and so you must be careful to ensure that you are comparing adjacent tracks when comparing speeds etc.
For example, a spurt of speed at the right end of the chart may be seen simply because the leading boat has rounded the windward mark and has taken off on a reach.
The vertical line represents the current position of the current track. As the current boat navigates the leg, this line will track from left to right. When the current boat rounds the mark at the end of the leg, the next leg will be plotted.
You can drag the vertical line right and left by holding down Mouse button 1. As you do so, the boats will follow to maintain their position relative to the chart.
Stretch Mode
Select the Stretch checkbox to lengthen the chart horizontally. A scroll bar appears underneath the chart to scroll left and right. When you run the replay, the chart scrolls automatically like a ticker tape.
Available Charts:
Chart |
Description |
Illustration |
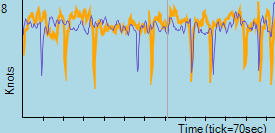
Speed - Instantaneous |
Instantaneous speed. Units are Km/h or knots, depending on the default units specified in the Settings dialog. |
|
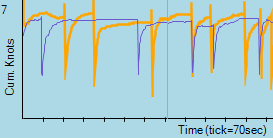
Speed - Cumulative |
Cumulative speed for each tack. Units are Km/h or knots, depending on the default units specified in the Settings dialog. |
|
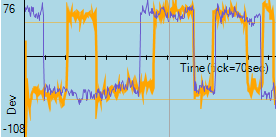
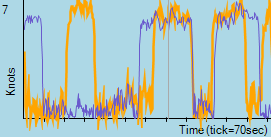
Deviation - Instantaneous |
Deviation in degrees from the direct line to the mark. Plots instantaneous deviation separately for port tack and starboard tack. Use to assess height to windward. |
|
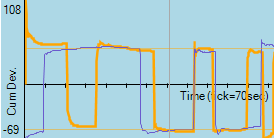
Deviation - Cumulative |
Deviation in degrees from the direct line to the mark. Plots cumulative deviation for each tack. Use to assess height to windward. |
|
VMG Relative to Course |
VMG is the effective speed along the Rhumb line, which is the direct line between the marks being sailed. Often sailors will choose to sail at an angle to the Rhumb line to obtain more speed. The most effective angle is that at which the VMG is highest. |
|
VMG Relative to Wind |
Sometimes it is more interesting to know the VMG relative to the wind. Examples are when training or when the course is not true. |
|
Custom Statistics |
TackTracker will provide a new chart for each custom statistic defined. |
|
Wind Speed |
A wind speed chart is provided in case you have imported wind speed data into the event. (See the Library Right Click menu) |
|
Go to Task Selection