Race Analysis
TackTracker was designed and built by sailors who wanted to gain insights and learn from tracking their racing. So built into TackTracker from the ground up are a comprehensive set of race analysis tools used and refined by sailors and coaches around the world.
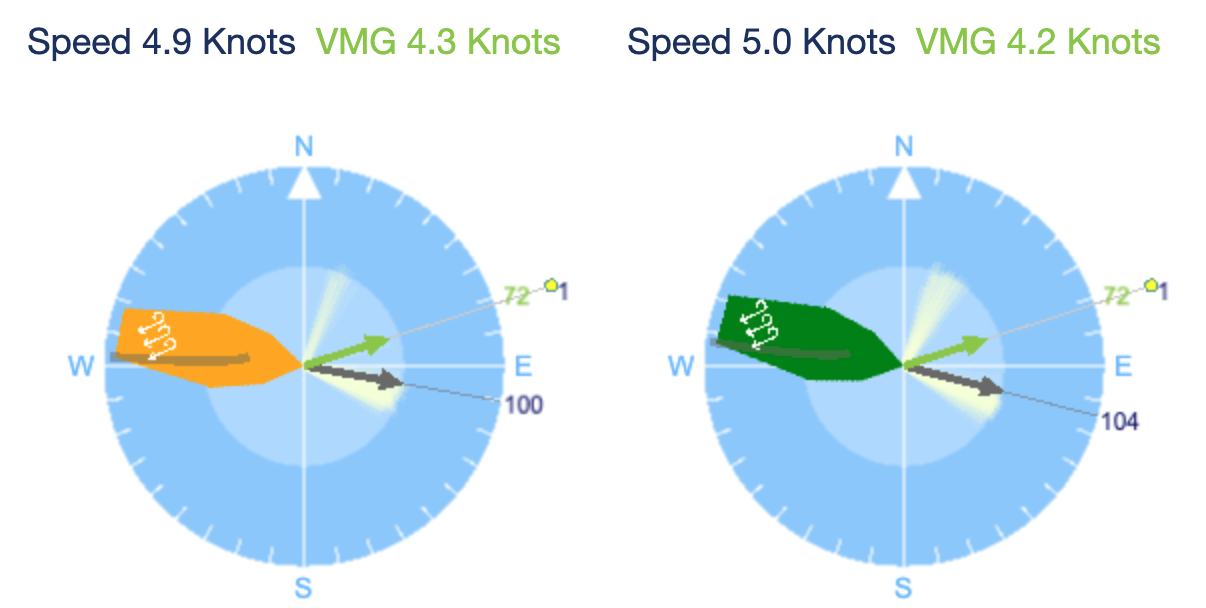
The Web Player's VMG Meter lets you compare your performance with another boat in real time
At the heart of TackTracker's race analysis is its ability to detect and analyse each leg and each tack your course - hence the name "Tack-Tracker". You can see at a glance the comparitive speeds, heights and distances travelled across each leg of the course. And TackTracker computes the placings of each boat all around the course even correcting for handicaps.
If you're after ready-built reports - for example a report showing times and placings for each competitor at leg roundings and at the finish - then take a look at TackTracker's Race Reports.
Or, you may want to know some of the features of TackTracker's race player so you can debrief your race and get insights into what happened on the course. In that case - read on!
A Quick Tour of Cool Tools
- Navigation and Timeline
- Maps and Satellite View
- Wind Direction
- Boat Tails
- Ruler and Guides
- Leader Board
- Speed and VMG
- VMG Meter
- Leg Analysis
Navigation and Timeline

TackTracker is immediately familiar with the video player like play and pause button. And if you want to fast forward to a particular point on the course, simply drag the boat along the Timeline. The Timeline shows the progress of the selected boat through the race and the points at which each mark is rounded.
Many people prefer to watch a windword work with boats travelling up the screen. No problem: TackTracker lets you rotate the map to any desired orientation. Just click on the compass at the top right of the map and rotate to the desired orientation.
Maps
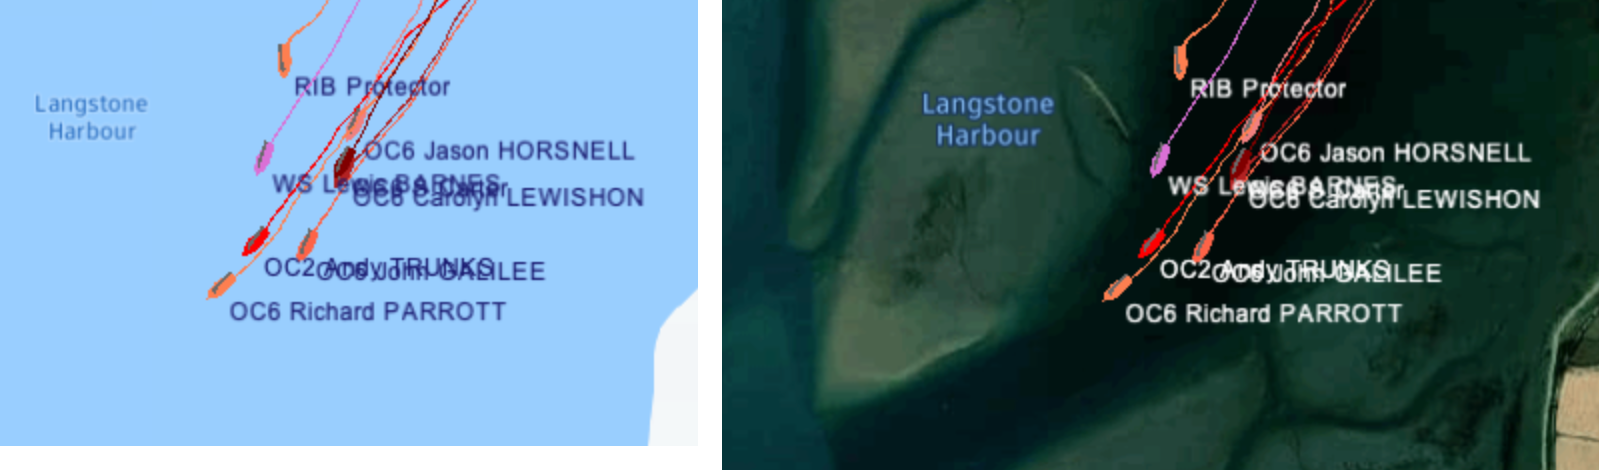
TackTracker's race replay features online maps to put your course in it's physical context. Whilst map view is the default, you can also view satellite images or turn maps off. The satellite view can be especially useful to illuminate natural features such as channels that boats must navigate and which are not visible on the map.
Wind Direction
When analysing the race, TackTracker automatically estimates the wind direction. This information is used to position the sails on the boats, determine the type of leg being sailed and to calculate the VMG relative to the wind.
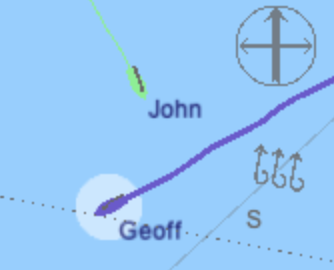
The current estimated wind direction at any point of time is shown by a wind indicator at the top right of the display.
You can override TackTracker's wind estimate if you believe it is wrong or have actual wind measurements. You can set the direction multiple times at different points around the course. You can also import CSV wind data into TackTracker.
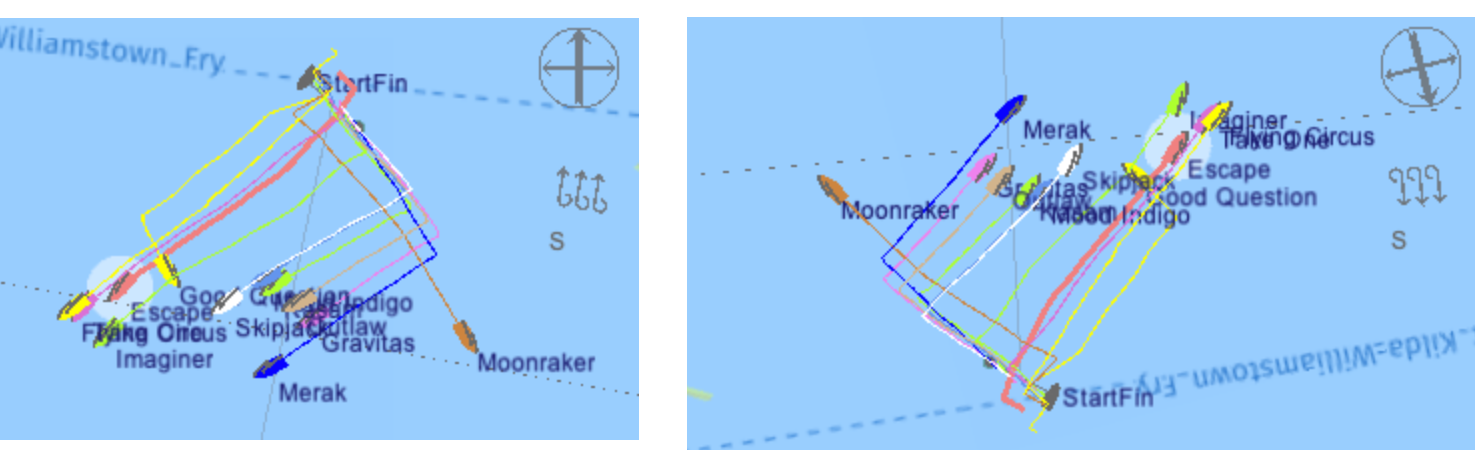
Boat Tails
A simple, but highly useful feature of TackTracker is the colored line drawn behind the boat, which creates a graphical picture of an entire leg's racing. You can see at a glance how the wind was shifting, where the lefts and knocks were and who was taking advantage of them.
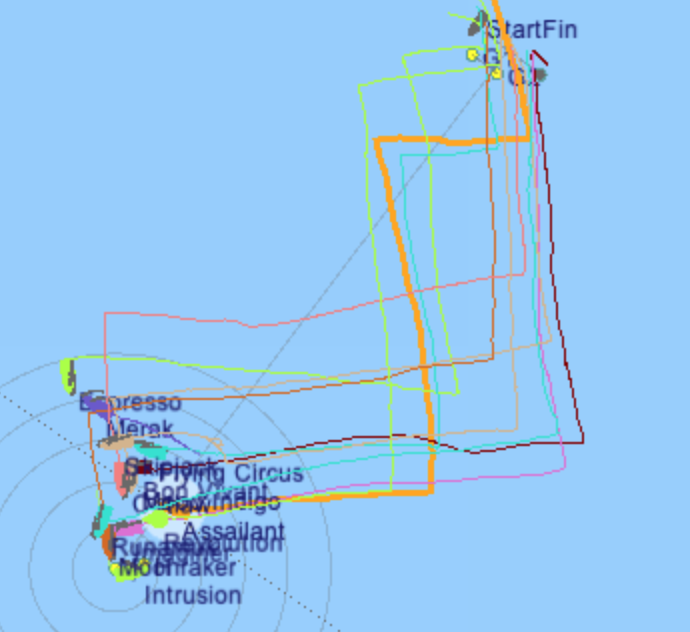
TackTracker offers several options for displaying the tracks of each craft (called a "tail"). The most commonly useful is the "long" tail which shows the entire track for the current leg of the course.
Ruler and Guides
As the boats approach a mark, circular rings 100m apart indicate the distance to the mark. Right at the mark, a 3 boat-length ring indicates the zone.
A line perpendicular to the wind direction across the bow of the currently selected boat tells you who is in front and who is behind. We also show the "rhumb line", which is the line directly between the two marks.
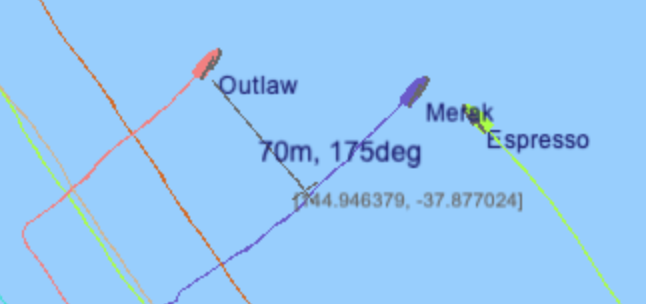
Often you may want to measure the distance between boats. The ruler shows you the distance and bearing between any two points on the map. Just click anywhere on the map to turn on the ruler.
Leader Board
Click the "person" icon to show a dynamic leaderboard of all competitors and their relative placings throughout the course.
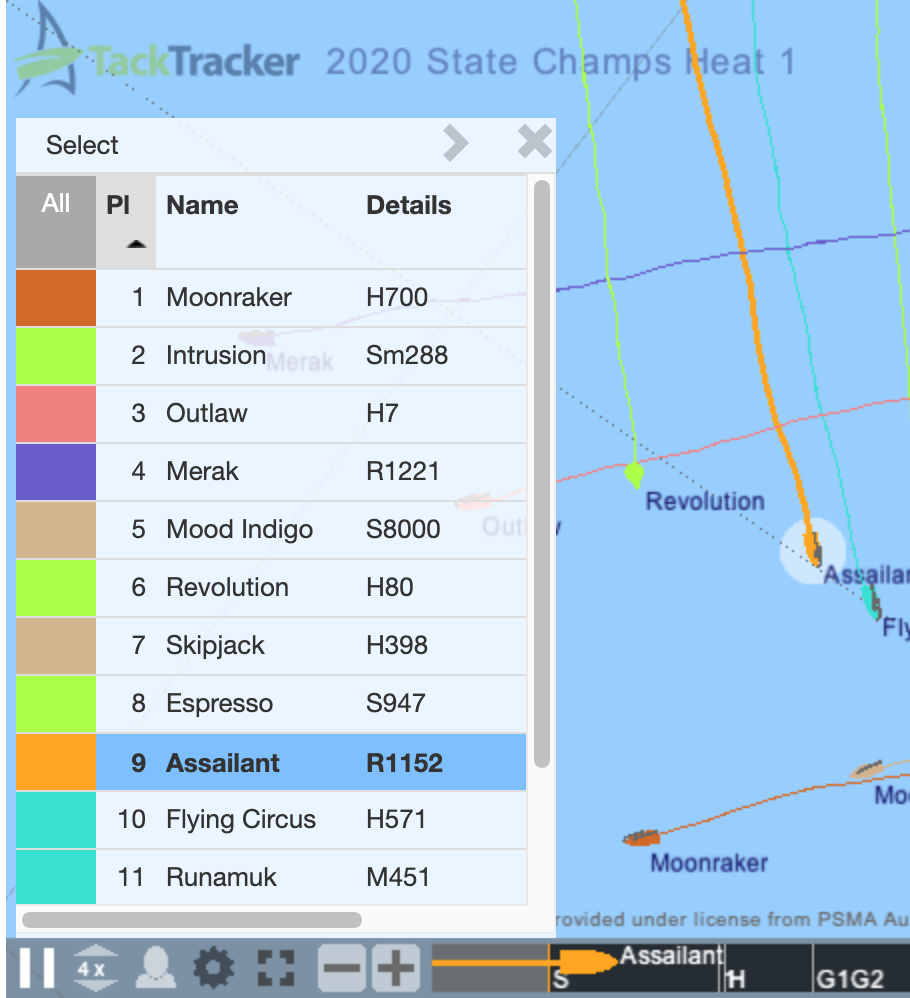
Click the right arrow at the top of the board to show the distance each boat has to go to finish and the distance between each boat and the leader.
Speed and VMG
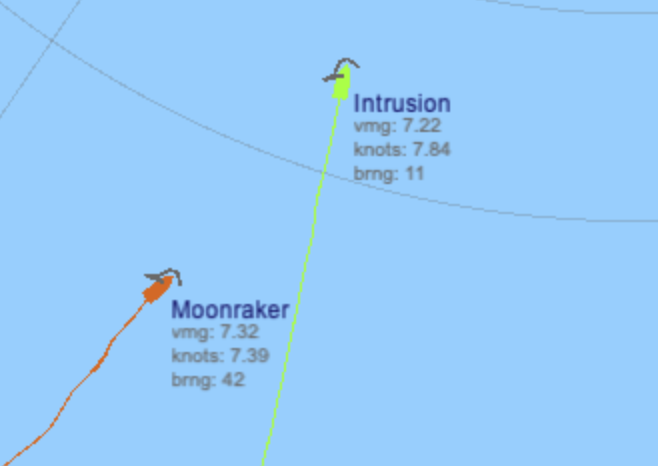
TackTracker calculates the speed and Velocity Made Good (VMG) of each competitor at all times. You can turn on display of speed, VMG and bearing of each boat. Or, just hover your mouse over any boat to display this information.
VMG Meter
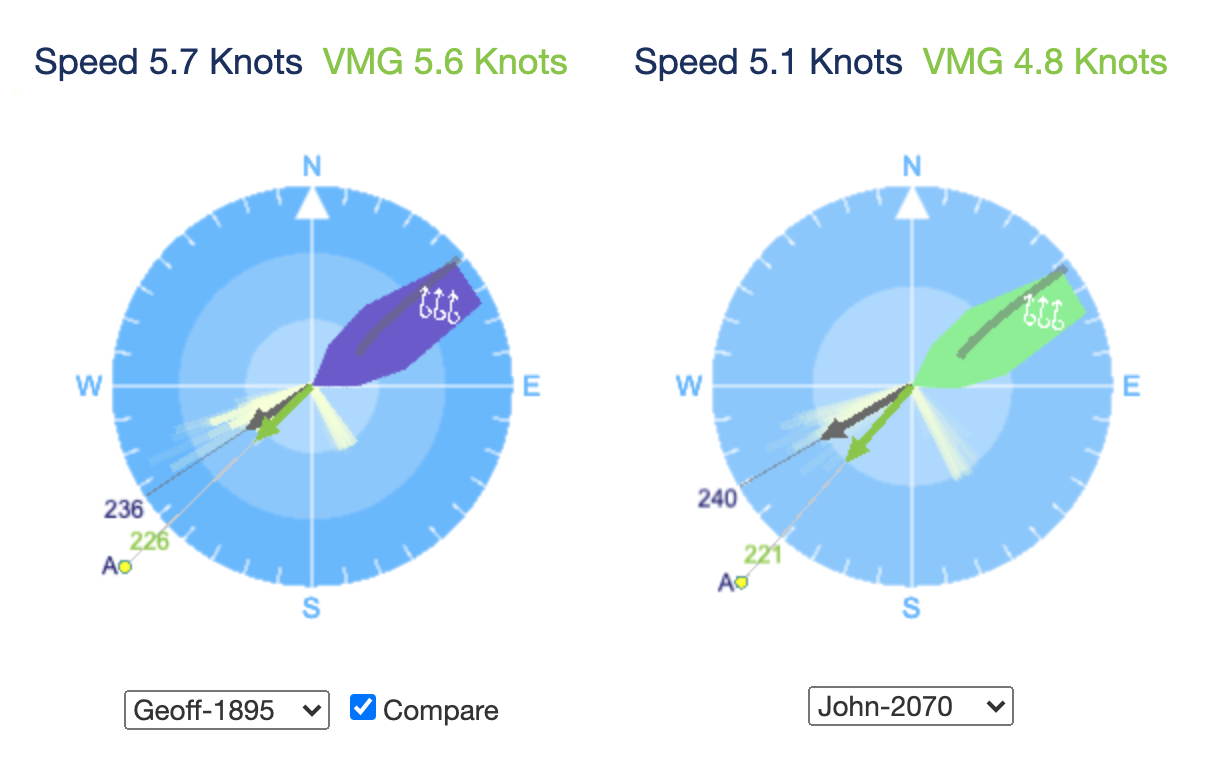
The VMG Meter graphically shows a selected boat's speed and VMG over the course of a leg. You can compare the selected boat with any other competitor in real time by displaying two VMG meter's side by side.
The VMG Meter appears underneath the player in the normal mode. In fullscreen mode, a control is provided in the toolbar to turn on the VMG meter inside the player.

Leg Analysis
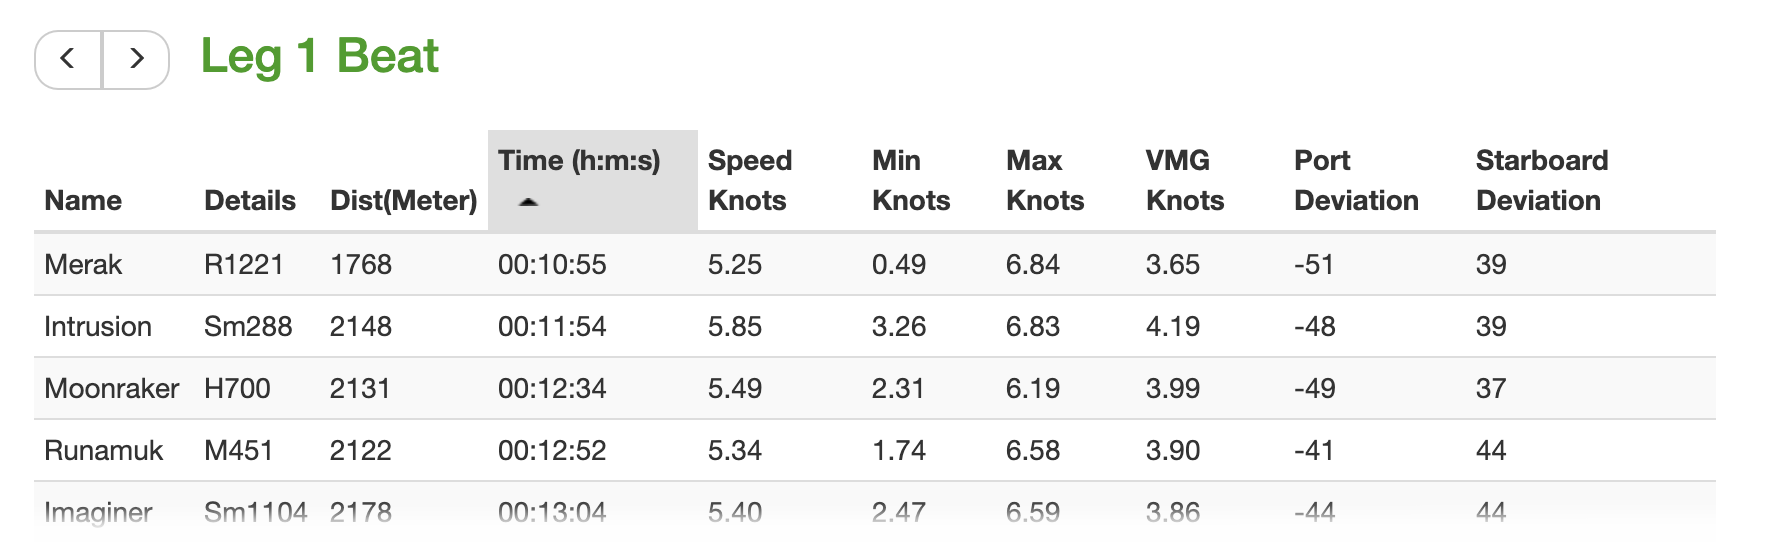
TackTracker provides a leg by leg performance summary for each boat and this is the perfect starting point for any race analysis.
The Leg Analysis table appears below the player and shows at a glance which boats travelled the least distance, sailed the farthest or pointed the highest on port or starboard tack.
You can sort the table by any of the columns by clicking on the column heading. For example, you might want to sort by distance travelled or by speed.
The deviation columns show the average deviation from the rhumb line when sailing on port tack and on starboard tack, and indicate which boats were able to sail higher on each tack.
This table is kept in sync with the player - so when the current boat starts a new leg, the table switches to that new leg automatically. You can also scroll through each leg in the table using the buttons at the top. Selecting a row in the table selects and highlights the current boat in the player. Isn't that cool!
 Web Record